

The Soundtrack
Role
Personal project, learning and exploring
Timeline
March 2020 - September 2021
Skills
Data visualization, Python, React JS, HTML/CSS, d3.js
The Soundtrack
Role
Personal project, learning and exploring
Timeline
March 2020 - September 2021
Skills
Data visualization, Python, React JS, HTML/CSS, d3.js
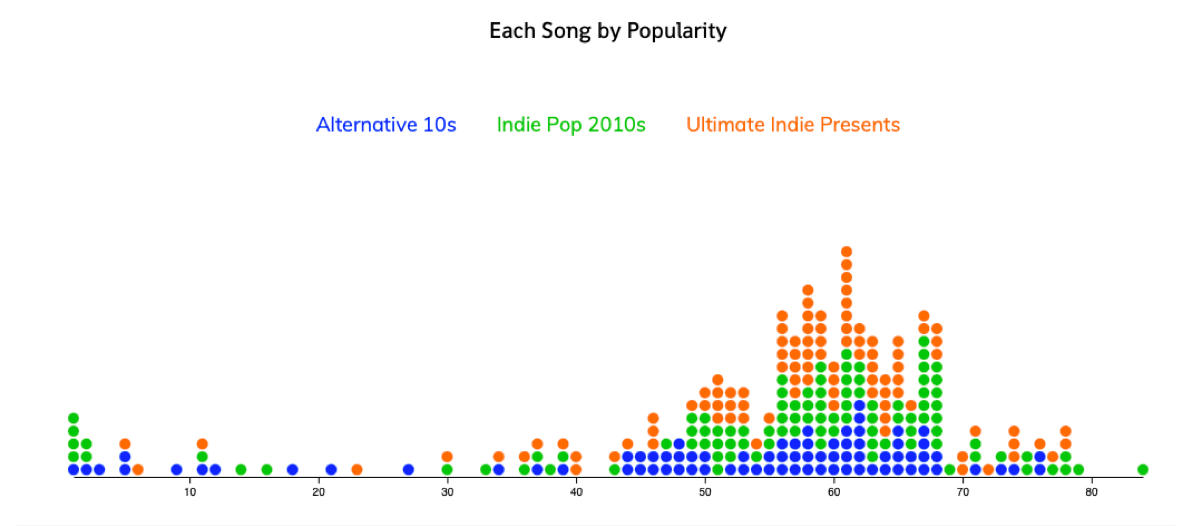
I’ve always been interested in data journalism as a means of combining my interests of code, storytelling, and design. Data visualization has been a skill I’ve always wanted to learn. Over the course of two visual essays, I practiced my d3.js skills to tell stories about music.
Code
I used Python to gather and analyze data from Spotify. By connecting to their API I got access
to their entire music library and was able to search and collect song data by year, artist,
genre, etc. After collecting and analyzing data, I created charts, graphs, and other visuals
to tell a story.
D3.js is a super powerful library, and I only scratched the surface of its capabilities.
In the future I’d love to learn more about making my visualizations more interactive and more
cohesive within the essay or story I tell.
Storytelling
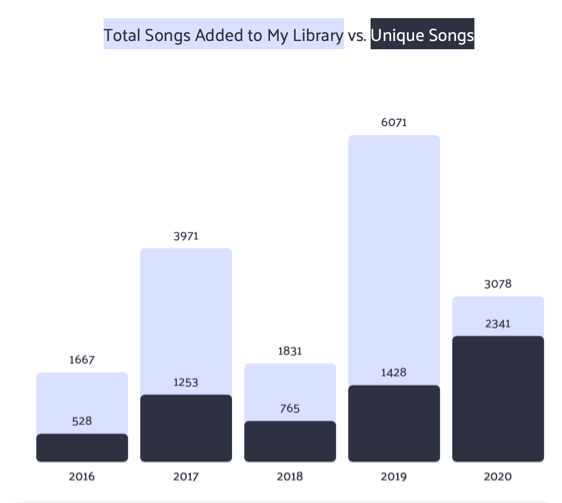
Music has always been one of my biggest interests outside of work. Since I listen to
hundreds of hours per year across hundreds of different playlists, I decided it’d be
a great place to gather data.
I identified two potential story ideas based on the Indie music genre and Echo Chambers
in music. I wanted to figure out if data can musically define Indie as a genre.
For my echo chambers process I recognized the broader implications for social media
and social bubbles and tried to use music as a simple way to display these principles.
Design
I wanted the website to be clean and simple. In a visual essay, I think the data should
speak for itself so I wanted to make the visualizations the centerpieces. They should
be easy to understand and relevant to the story.
In the future interactivity and animation will take the UX to the next level.
